


The radar image is not the result of one single signal conversion function. It is rather the consequence of a sequence of transformations. SkyRadar's training radar allows students to play on most of the stages concurrently - and independently!
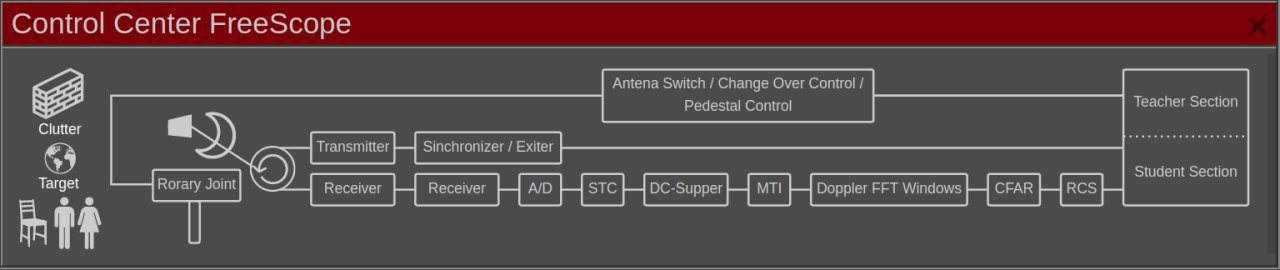
The following image shows a typical radar signal conversion chain. The panel is actually an interactive panel from SkyRadar's FreeScopes software (like all other subsequent images).
Initially, the radar image is pretty fuzzy and requires calibration. In modern radar systems this calibration is pre-set.
But radar scholars (no matter whether at university or in ATC) need to understand the various manipulations, and their possible sequences.
Understanding them will help in various matters like learning how to design or to calibrate a radar. In ATC this understanding helps to detect and localize errors in a degraded radar, based on the variation of the radar image.
Let us walk through a calibration and look at the radar images in the A-Scopes in parallel. Alternatively we could have done it in the PPI or the B-Scope. But the A-scope is a pretty neat tool for comparison.
Setting the controls
They available controls may vary depending on the version and configuration of your FreeScopes software.
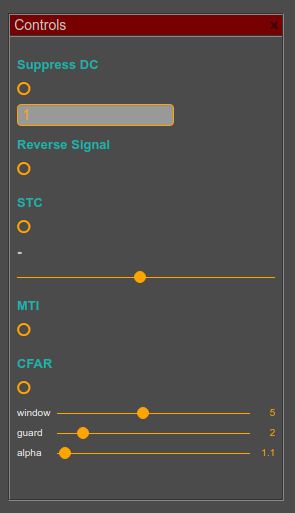
In the control panel, you can set functions and filter values. You can set:
- Suppress DC (eliminating the echo of the source)
- Reverse the signal (this reverses the signal, a feature that is sometimes needed in FFT)
- Set the Sensitive Time Control (STC)
- Activate the MTI
- Set and configure the CFAR (static threshold can be set in the scopes directly)
This is also the sequence, which is currently pre-set in FreeScopes.
In addition to the centrally configured functions, the A-scope allows to limit signal threshold and range locally per scope (see image below).
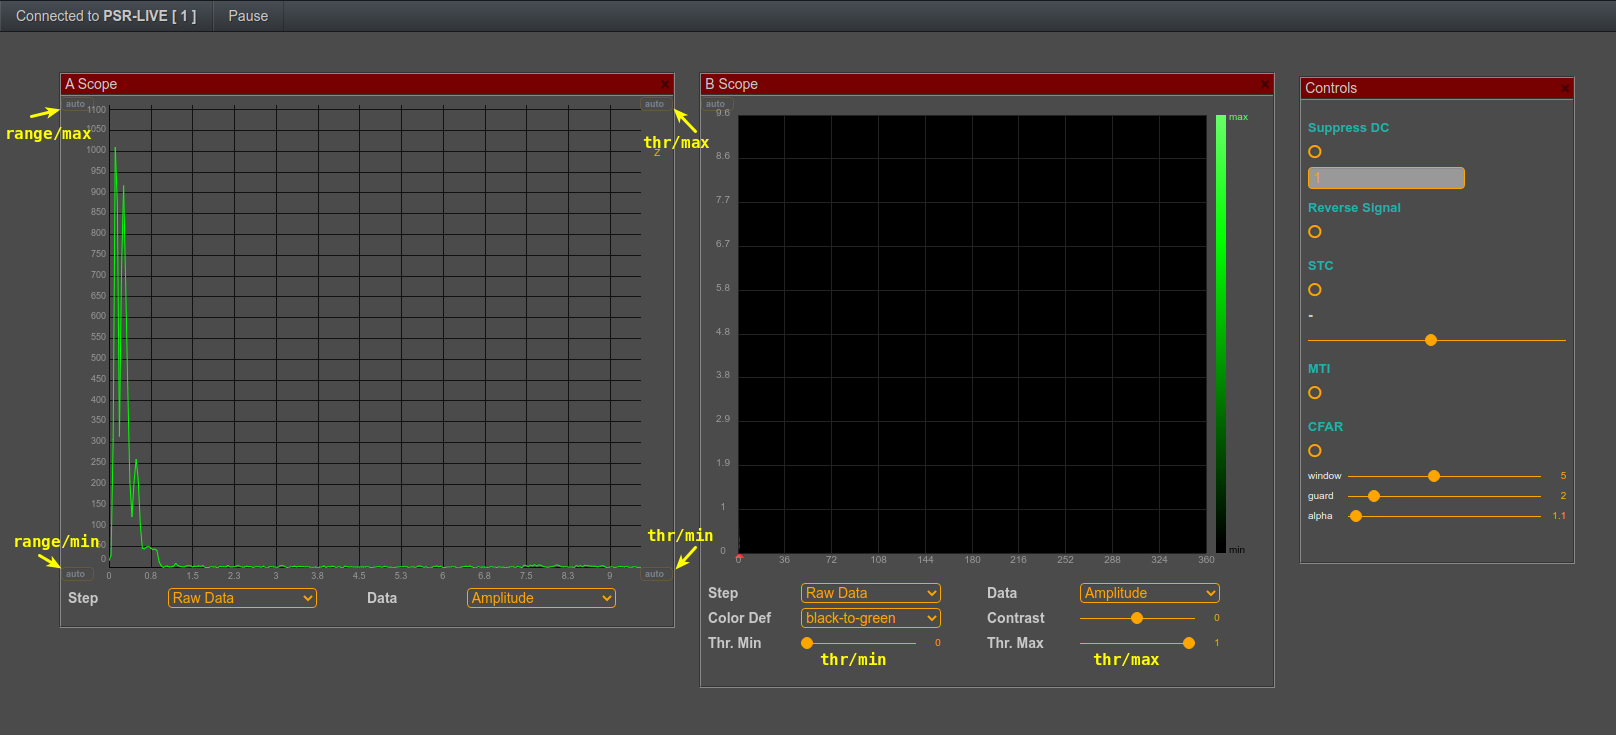
Figure: Setting max / min range and threshold (click on the image to enlarge)
The Choice Box below the scopes
In the choice box below the scopes, you will find the signal conversion chain:
First you get Raw Data, then Suppress DC, then STC, then MTI, then CFAR.
It is important to understand that the signals will be manipulated in this exact sequence!
 The first one shows the unmanipulated Raw Data
- The second shows the signal after you suppress the echo from the source (if you activated it in the control panel), The function is called Suppress DC
- The third shows Suppress DC + STC (if you activated it in the control panel)
- The fourth shows Suppress DC + STC + MTI
- The last one shows Suppress DC + STC + MTI + CFAR
Comparing all stages in the radar block diagram
The student has the possibility to compare all stages in the signal conversion chain.
This will allow to understand what impact each of these functions / filters will have (see image below).
You can clearly see how the signal gets better and better throughout the signal conversion chain, starting pretty fuzzy on the left, and evolving slowly into a clear signal on the right.
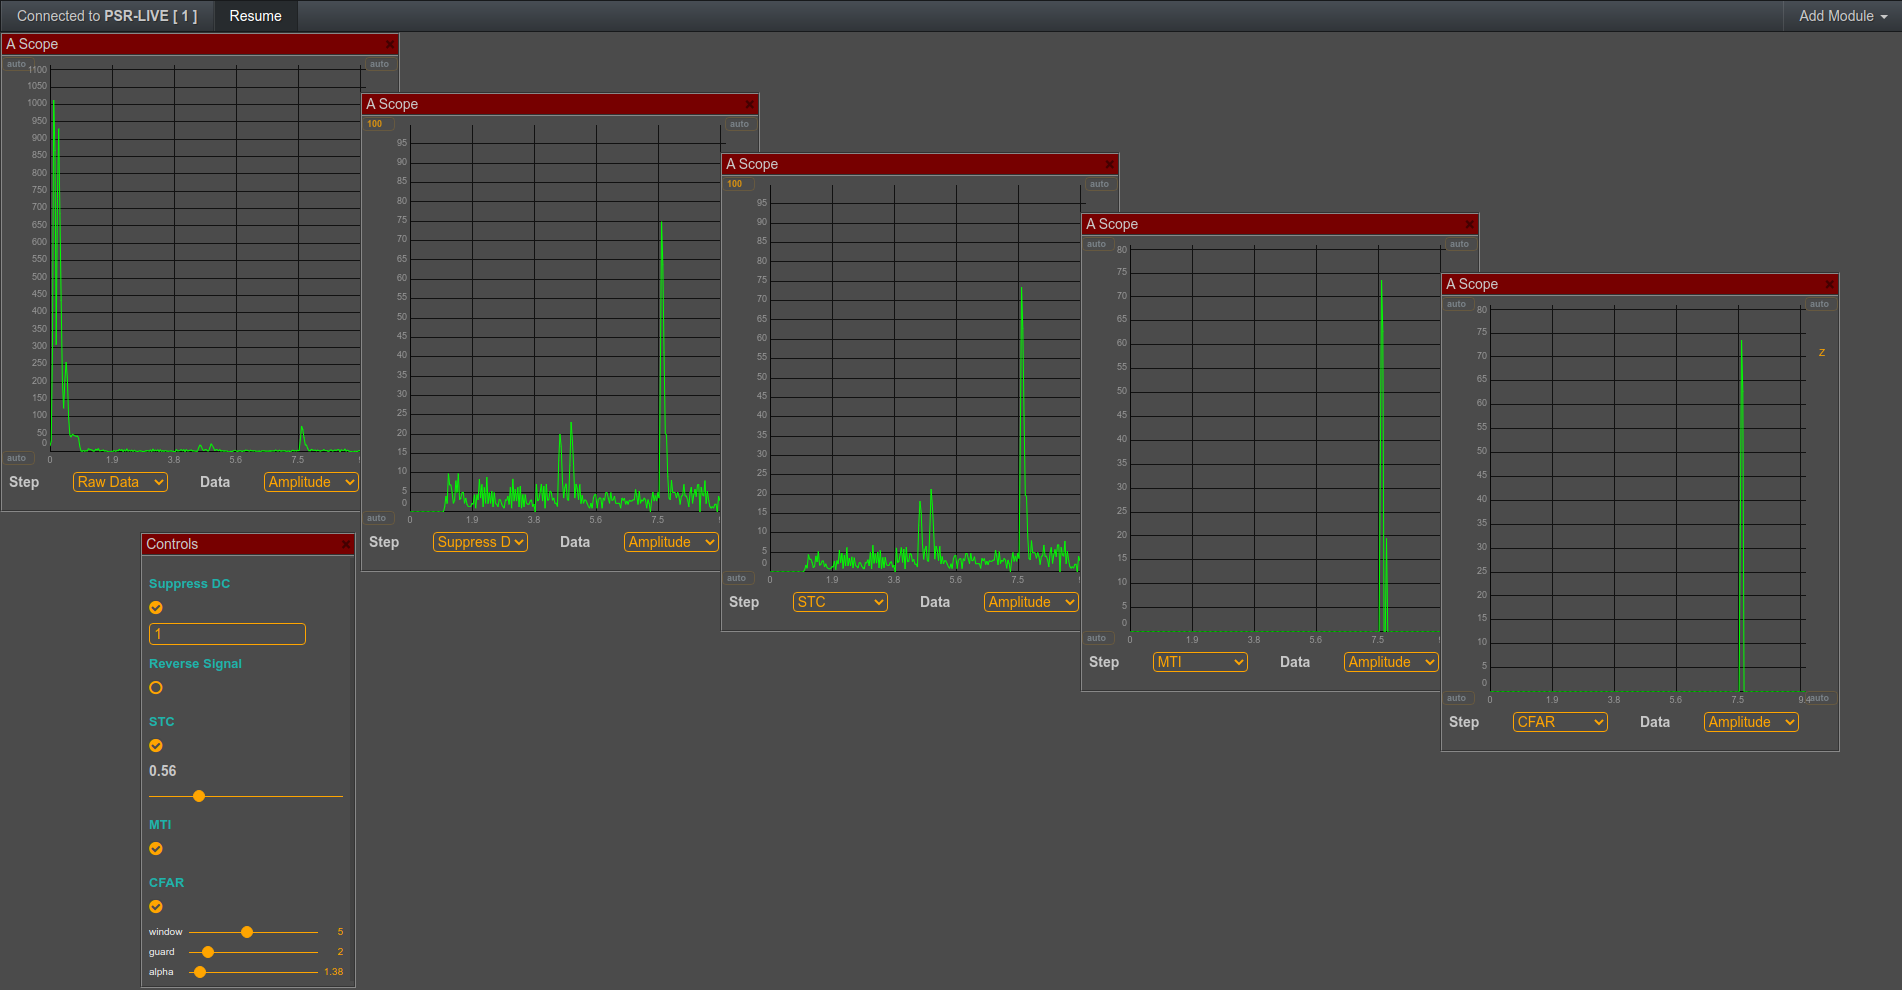
Figure: Signal conversion chain in 5 A-scopes (click on the image to enlarge)
- The first A-Scope shows the raw data, the target is hardly visible;
- In the second A-Scope, we have suppressed the reflections of the source (suppress DC). The y-axis recalibrates on the biggest target, as the source disappeared, the real (moving) target becomes prominent;
- In the 3rd section we apply the STC. It visibly reduces the near range reflections
- The fourth image shows the impact of the Moving Target Indication (MTI). We can apply this, as we are looking at a moving target (please read our article on MTI and MTD, and watch the included videos to learn more). In case of static targets, we could not apply this function, as we would eliminate the complete screen. In the case of one or multiple static targets, the next step would provide ultimate clarity to the radar image;

- Ultimate beauty comes with the CFAR, the Constant False Alarm Rate. In our case, following the MTI it only sharpens the amplitude. When looking at static images, CFAR is extremely powerful. Prerequisite is that the student understood how to calibrate the three parameters correctly:
-
- alpha - defining the threshold for the probability of false alarm (pfa)
and detection (pf) - window - the size of the observation window to estimate the noise floor (noise power)
- guard cells - they are the cells around the CUT which we ignore because of side-lobes from the target.
(Watch the videos and read the articles to learn more).
- alpha - defining the threshold for the probability of false alarm (pfa)
Harnessing the advantages of the floating panels
The floating panels in SkyRadar's FreeScopes enable the students to compare the
A-scopes representing each stage.
In the example we just used A-Scopes. But You can also add PPIs or B-Scopes and play on other parameters like the I or the Q signal, FFT etc.
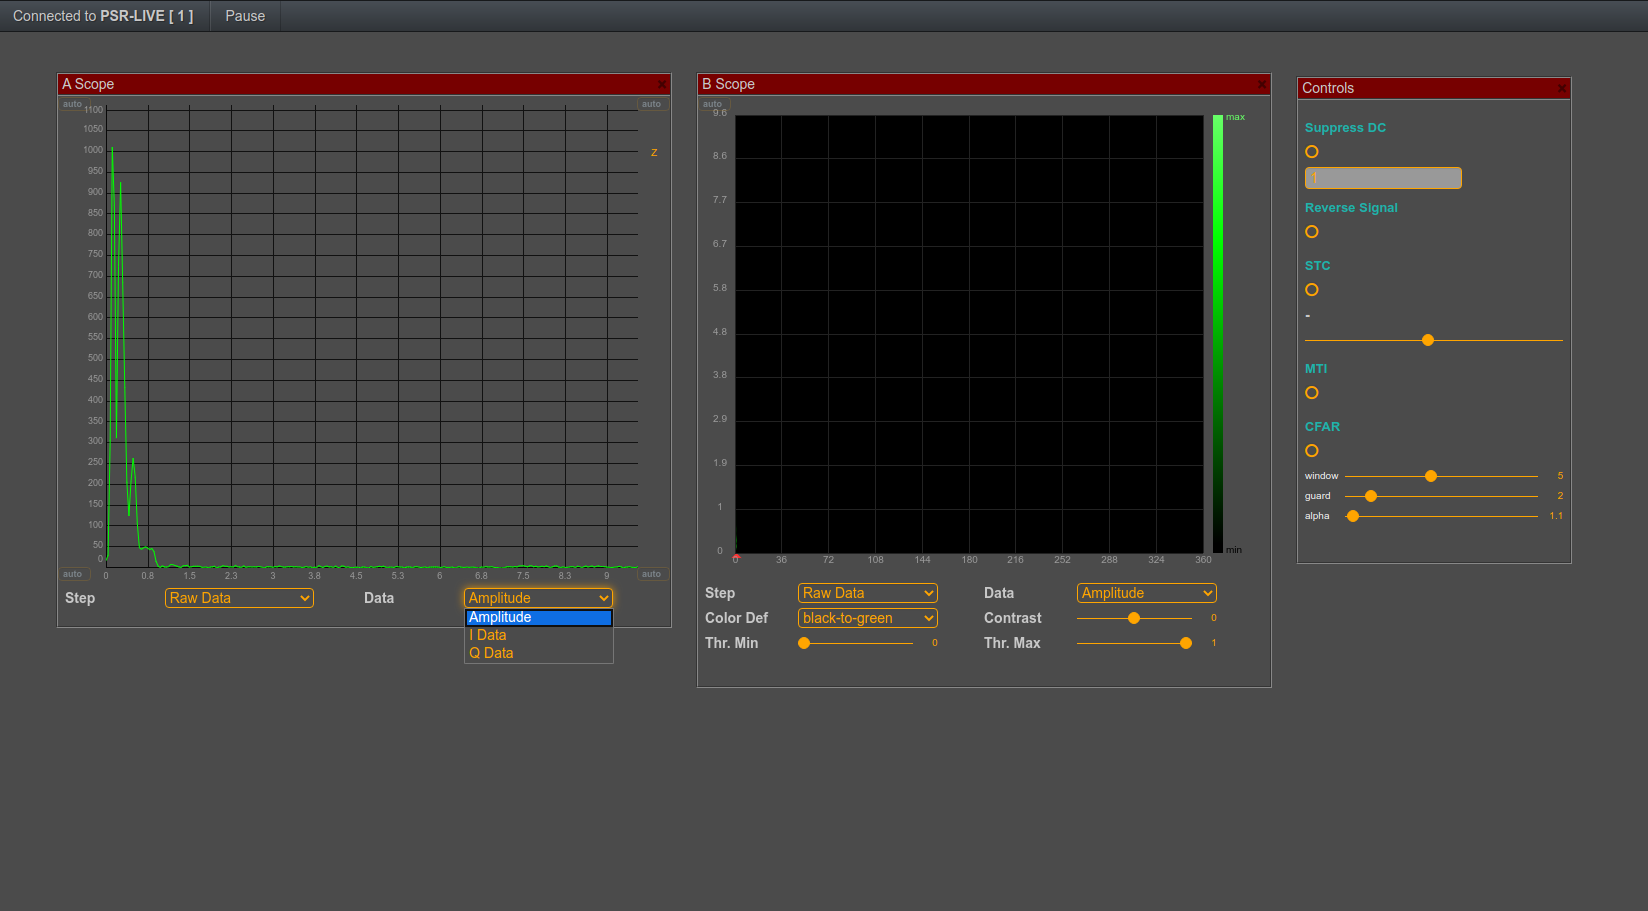
Figure: Selecting I and Q signal (click on the image to enlarge)
To gain more space, you could stretch the browser window across 2, 3 or more monitors. This will allow you to place even more floating panels. Also the interactive block diagram of the signal conversion chain can be dragged in.
Playing on the settings in the control panel makes the learning experience intense.
Let us talk on your Radar Training Requirements!
And stay tuned by subscribing to our regular posts!