


This article describes signals and operation of an Instrument Landing System ILS, Distance Measuring Equipment DME and a VHF Omnidirectional Range (VOR). This article requires an advanced knowledge of mathematics.
 This article uses the following abbreviations:
-
AGC: Automatic Gain Control
-
CL: Course Line
-
CLR: Clearance
-
CSB: Carrier plus Sideband
-
DS: Displacement Sensitivity
-
LLZ: Localizer
-
SBO: Sideband Only
-
DDM: Difference in Depth of Modulation
-
RMM: Remote Maintenance Monitor
-
RMS: Remote Monitoring System
-
SDM: Sum in Depth of Modulation
-
VSWR: Voltage Standing Wave Ratio
Instrument Landing System ILS
ILS System Overview
The infographic below describes the system architecture of an Instrument Landing System.
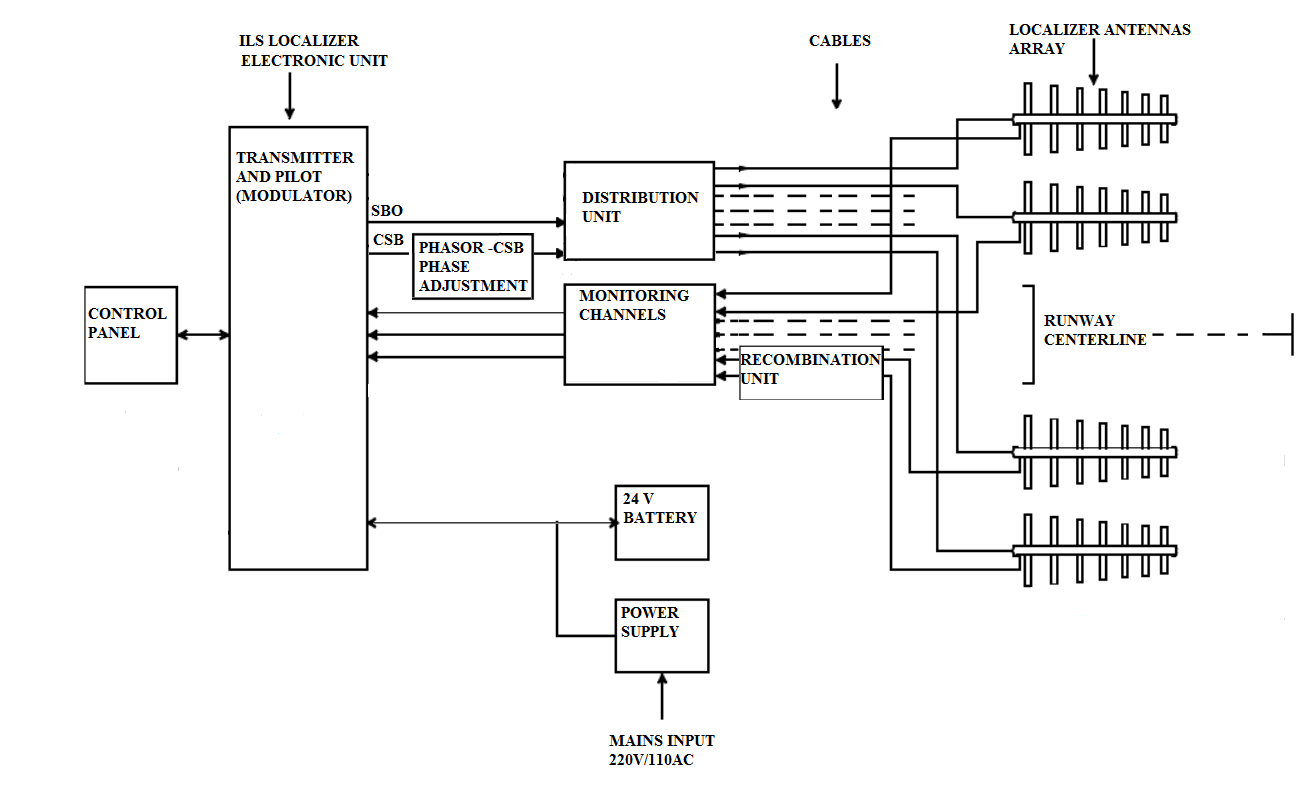
Fig1. ILS block diagram
The localizer signal
The modulation type of all ILS transmitters is the good old amplitude modulation (AM). The carrier oscillation in the localizer frequency range is 108.00 MHz to 111.975 MHz modulated with a 90Hz and a 150Hz tone signal.
This signal is called CSB (Carrier and Side Bands).
Mathematically, it can be described as follows:
s(t) = [1 + M90 * sin(3ωcar t) + M150 * sin(5t) ] cos(ωfund t) (1)
Where ωcar is the angular frequency of the carrier and ωfund the angular frequency of the
30 Hz fundamental frequency. M90 and M150 are the modulation factors, those at which LLZ = 0.2 is to be set.
In addition, a signal with suppressed carrier (SBO, Side Bands Only) is generated. In this SBO signal, the 150Hz NF signal becomes out of phase and the 90Hz AF signal in-phase modulated relative to the COD signal. Again, the mathematical formula:
d(t) = k[sin (5ωt) - sin(3ωt) ] cos(ωt + fi) (2)
where k is the relative level of the SBO signal relative to the CSB signal, and f is the relative phase of the SBO signal to the CSB signal, and
ω = 2πf (3)
The basic ILS signals (COD and SBO) are fed into the up to 21 dipoles via a high-frequency load distributor that feeds the transmitting antenna. A load distributor (Antenna Distribution Unit, ADU) divides the RF by amount and Phase to a sophisticated system on the individual antennas, each for CSB and SBO according to different laws. This forms by superimposing the individual signals the required signal in space.
The basic formula with the same shifted signal φ to calculate the electric field component E as a function of azimuth angle Ɵ and the elevation Ψ is given when the individual antennas with opposite phase currents are fed:
`E(theta) = kC(theta)[E_0 + 2 sum_(i=1)^n x_i sin(pi/lambda a_i sin theta)]` (4)
 Where C (Θ, Ψ) is the directivity of the single dipole, the parenthesis pressure to the right of C describes the directivity of two instead of the single antenna imaginary omnidirectional antenna. Subsequently, cosΨ ≈ 1 can be set, because ILS elevation is small.
By increasing the distance d is the number of maxima and minima of the resulting directional characteristic larger, this is symmetrical to the angle Θ = 0 (Landing trajectory).
The most important parameter of an ILS signal is the degree of modulation. The two sound signals are at the LLZ, as described above, modulated with 20% modulation level. The actual information is now in the Difference of the modulation degrees of these sound signals.
The difference is called DDM (Difference in Depth of Modulation) and is the essence of the ILS functionality. The field strength is only of minor importance.
Exactly in the middle in front of the antenna line you are in the zero point of all antenna pairs. You receive only the signal of the middle single dipole. This means that you receive both sound signals with 20% modulation level. The difference is M (150Hz) - M (90Hz) = 0%.

VHF Omnidirectional Range (VOR)
The signal of a VOR station settles (regardless of the above indicated technical realization of the ground station) from a total of three signal components together.
Since the searched-after line is obtained by means of a phase comparison of two signals with a frequency of 30 Hz each, one of these signals must be transmitted on a subcarrier. Otherwise, the two signals will be in the coverage area of the station overlay and be cancelled.
The frequency of the subcarrier was set at 9.96 kHz, the cosinusoidal course of one of 30 Hz signals frequency modulates this with a frequency deviation of ± 480 Hz.
This changes the instantaneous frequency of the subcarrier 30 times per second from 9.96 kHz to 9.96 + 0.48 kHz, 9.96 kHz, 9.96-0.48 kHz and backwards to 9.96 kHz. The remaining 30 Hz signal is added to the subcarrier, as well like the third part, which is the identifier of the VOR.
The identifier is similar to the NDB and will transmit (Ident) as a sounding telegraph, the Morse code so audible with a 1020 Hz tone. Some VOR stations transmit the identifier additionally as a voice signal. The sum of these three parts forms the Navigation message of the VOR station, its temporal run is shown in Fig2 bellow
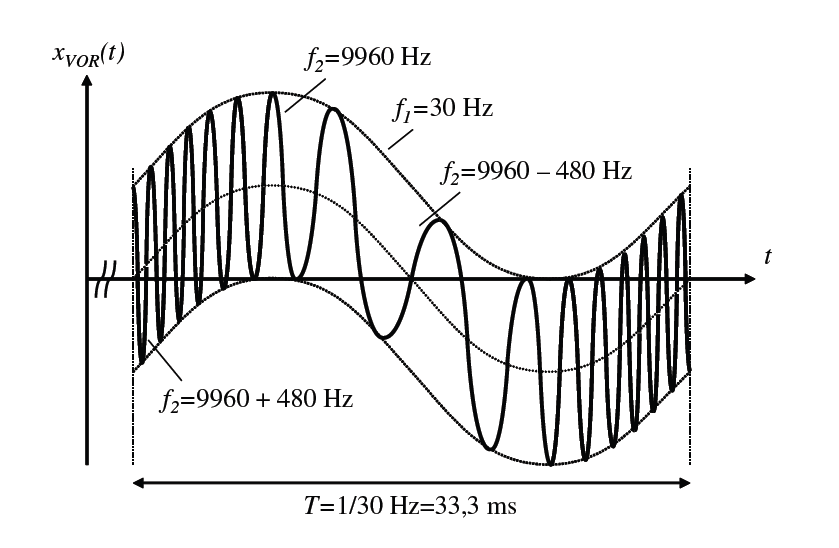
Fig 2. VOR without ident
All three signal components are amplitude modulated with a degree of modulation of 30% on the high frequency carrier. In this way, a frequency spectrum of the radiated signal arises as shown in Fig. 3. Each of the two sidebands contains the navigation message described above in the three subbands: at a distance of ± 30 Hz to the carrier frequency a sine signal, in the lower band of fc ± (300 - 3300) Hz the Morse or speech recognition and in the lower band at fc ± 9, 96 kHz the frequency-modulated sinusoidal signal. The spectral lines in the subband at f c ± 9.96 kHz shown in gray in Fig. 3 are due to the frequency modulation of the subcarrier with the 30 Hz signal - these lines are at a constant distance of 30 Hz from each other.
Technically, the illustrated spectrum can be generated in two different ways. On the one hand with the aid of a rotating directional antenna characteristic (conventional VOR), on the other hand by utilizing the Doppler effect (Doppler VOR, DVOR). In the first case, the frequency-modulated component and the Ident component are radiated non-directional, the amplitude-modulated component at fc ± 30 Hz results from the rotating directional characteristic of the antenna. The frequency-modulated signal has the function of the reference phase, the amplitude modulus 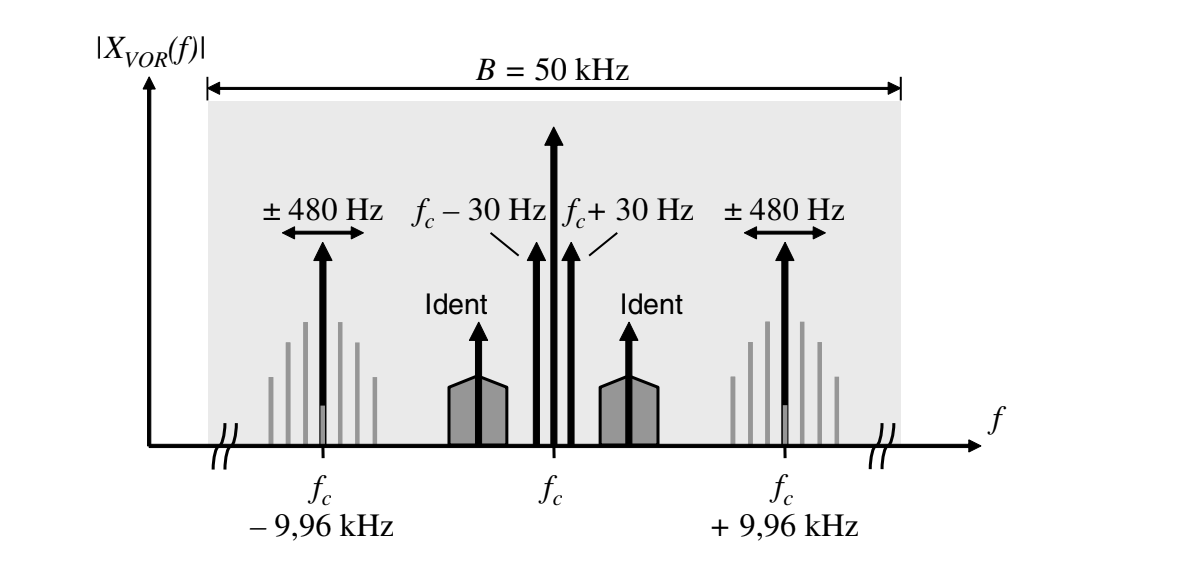
Fig 3. Magnitude spectrum of the VOR radiated signal
The signal that is emitted depends on the particular radial of the observer. With the DVOR, the frequency-modulated component, on the other hand, is produced with the aid of the Doppler effect and contains the LOP information, while the amplitude-modulated component serves as the reference phase and is radiated in an undirected manner together with the Ident component. Thus, the composition of the VOR signal xVOR (regardless of the chosen implementation of the ground station) can be formulated mathematically:
𝑥𝑉𝑂𝑅(𝑡)=𝑥̂{1+𝑚3[𝑥𝐿𝑂𝑃(𝑡)+𝑋𝑅𝑒𝑓(𝑡)+𝑋𝐼𝑑𝑒𝑛𝑡(𝑡)]}∗cos(2𝜋𝑓𝑐𝑡) (5)
Signal composition of a CVOR
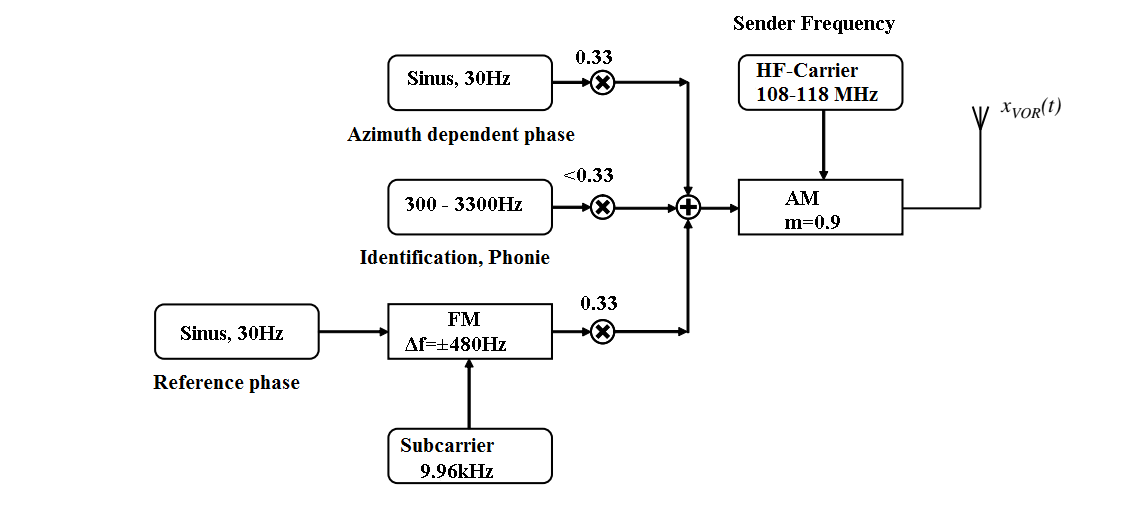

Fig 4. Signal CVOR
For this purpose, the reference signal xRef(t) for the determination of the phase difference is frequency-modulated onto the auxiliary carrier and (together with the Ident component xIdent(t) is amplitude-modulated onto the carrier and fed with an omnidirectional antenna radiated. With the modulation degrees m = 0.9 of the amplitude modulation of the reference signal, mIdent ≤ 0.9 of the amplitude modulation of the Ident signals and η = 480 Hz / 30 Hz = 16 of the frequency modulation can the sidebands without carrier be given:
`x_(Ref) (t) = hat x_(Ref) cos [ 2 pi ( f_c - 9.96 text{kHz} ) t - eta sin ( 2 pi 30 text{Hz} t ) ] + hat x_(Ref) cos [ 2 pi ( f_c + 9.96 text{kHz} ) t + eta ` (6)
`x_(Ident) (t) = hat x_(Ident) cos ( 2 pi ( f_c - 1020 text{Hz} ) t ) f_text{Morse} ( t ) + hat x_(Ident) cost ( 2 pi ( f_c + 1020 text{Hz} ) t ) f_text{Morse} ( t )` (7)
The starting point for the generation of the circulating LOP main beam is a single Hertzian dipole with its known directional characteristic. She points perpendicular to the dipole axis on their maximum, in the direction of the axis is no radiation. The angular dependence of the transmission characteristic is expressed by a cosine function. The directional characteristic of a second 90 ° twisted dipole can be described in the same way with a sine function.
The dipole aligned in the north-south direction is used to generate the rotating antenna characteristic is operated with a cosine function xI, which is used in east-west direction aligned, however, with a sine function xQ. Will both dipoles to a cross-dipole and operated with the unmodulated carrier results in a rotating, eight-shaped antenna lobe x red (t, θ) (see Fig. 5), which is oriented in the north-south direction at time t = 0:
Radio beacon (VOR)
`x_(rot) ( t , theta ) = x_i cost ( theta ) cos ( 2 pi f_c t ) + x_Q ( t ) sin ( theta) cos 2 pi f_c t ) =`
`hat x_(rot) cos ( 2 pi 30 text{Hz} t ) cos ( theta ) cos ( 2 pi f_c t ) + `
`hat x_(rot) sin ( 2 pi text{Hz} t ) cos ( theta ) cos ( 2 pi f_c t )` (8)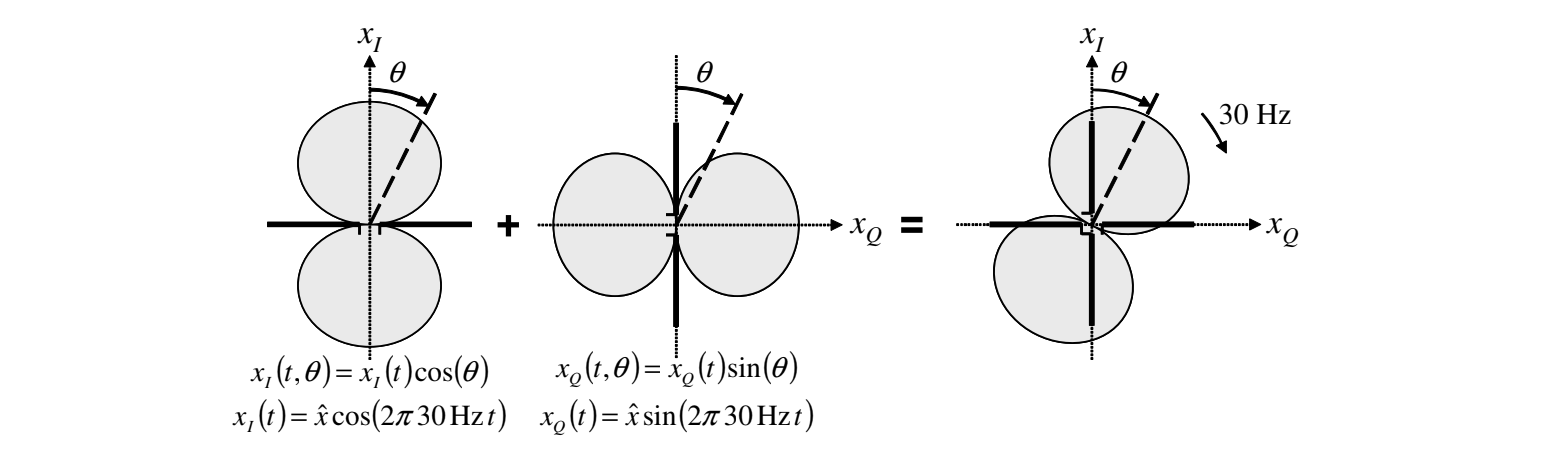
Fig 5. Crossdipol with quatrature components
The angle θ describes the local dependence, the farther the observer is in the clockwise direction from the reference magnetic north, the longer it takes him to reach the maximum of the antenna lobe. Due to the opposite propagation directions of the electromagnetic waves, the phase of the two lobes can be assigned a positive or negative sign. In addition, the cross dipole is supplemented by an omnidirectional loop antenna, which is also operated with the unmodulated carrier signal. In this way, another signal xomni (t) is generated with a positive phase position:
`X_(omni) ( t ) = hat x_omni cos ( 2 pi f_c t )` (9)
Both antenna signals are superimposed in space to a carotid-shaped one
Club rotating at 30 revolutions per second (Figure 6):
`x_text{LOP} ( t , theta ) = x_(rot) ( t , theta ) + x_text{omni}` (10)
`x_text{LOP} ( t , theta ) = [ hat x_text{omni} + x_(rot) cos ( 2 pi 30 text{Hz} - theta ) cos ( 2 pi f_c t )` (11)
The signal of the crossed dipole represents an amplitude modulation with suppressed carrier. The missing carrier is radiated through the omnidirectional loop antenna. With a suitable choice of the amplitudes xrot , xomni, xRef and xIdent , can the radiated navigation signal with rotating beam, the frequency-modulated reference signal and the Ident signal be obtained: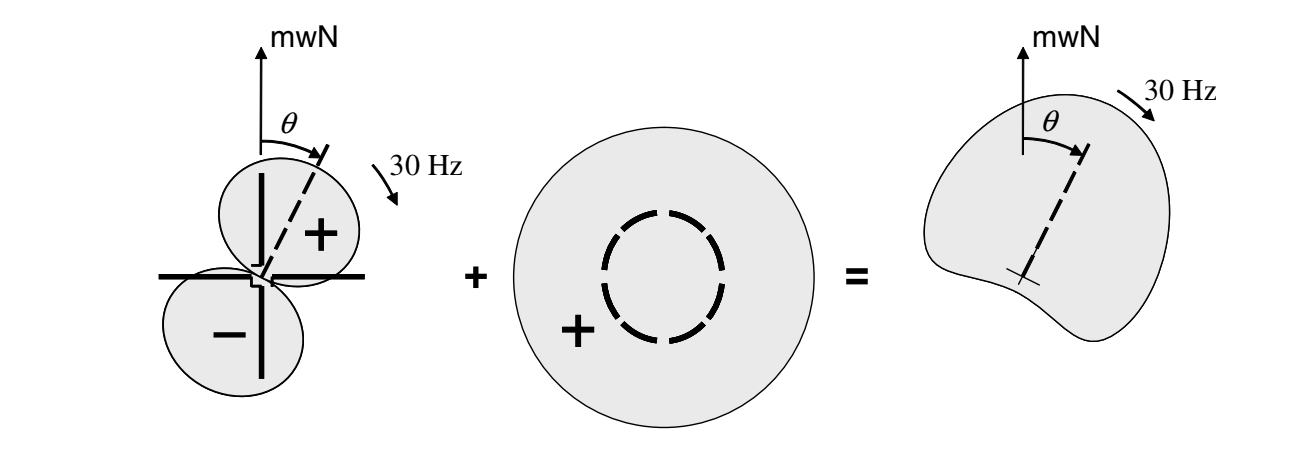
Fig 6: Generation of the Cardioid-form antenna characteristics
`X_textVOR( t , theta ) = `
`hat x cos ( 2 pi f_c t ) ( ... 1 + M_text{Ident}/3 cos ( 2 pi 1020 text{Hz} t ) ( f_text{Morse} (t) ) + ... + `
`hat x m/6 sum_( n=- oo )^oo J_n (eta) cos [ 2 pi ( f_c - 9.96 text{kHz} - n 30 text{Hz} t ] + ... +`
`hat x m/6 sum_( n=- oo )^oo eta cos [ 2 pi ( f_c + 9.96 text{kHz} - n 30 text{Hz} ) t ]` (12)
The bandwidth of the subcarrier occupied by the FM can be estimated from the Carson Formula to BFM = 1020 Hz, this results in the total bandwidth BVOR with about 21 kHz.
DME
In addition to the bottom-mounted installation (transponder), a DME uses an advance request transmitter (interrogator). The interrogator works in the free Frequency band from 1025 to 1150 MHz and sends as double pulse coded queries to the ground station. The transponder responds to a defined Delay time and transmits double pulses either in the frequency range of 962 - 1024 MHz and 1151 - 1213 MHz (X-channels) or in the frequency range of 1025 - 1150 MHz (Y channels, Fig. 7) to the aircraft.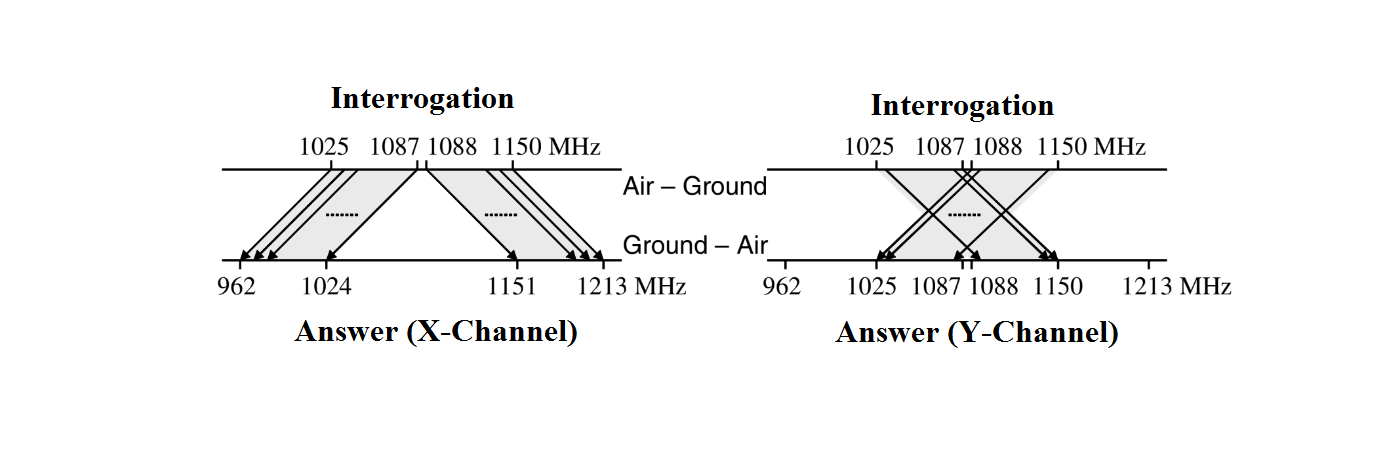
Fig 7. Conception of the X and Y channels at the DME
Thus, a total of 252 DME channels are available on 126 frequencies paired with the VOR channels. When selecting a VOR frequency in the navigation receiver, the assigned DME frequency is automatically set (Figure 9). The introduction of two modes became necessary after a reduction of the VOR bandwidth by half in the 1970s. Although the VOR channel has been doubled, no additional frequency band for DME was
Approved. Thus, the number of DME channels was realized based on a double use of the existing frequencies by defining the X and Y grid.
The original operating mode was defined as X channels. The new added VOR frequencies were coupled to the Y-grid.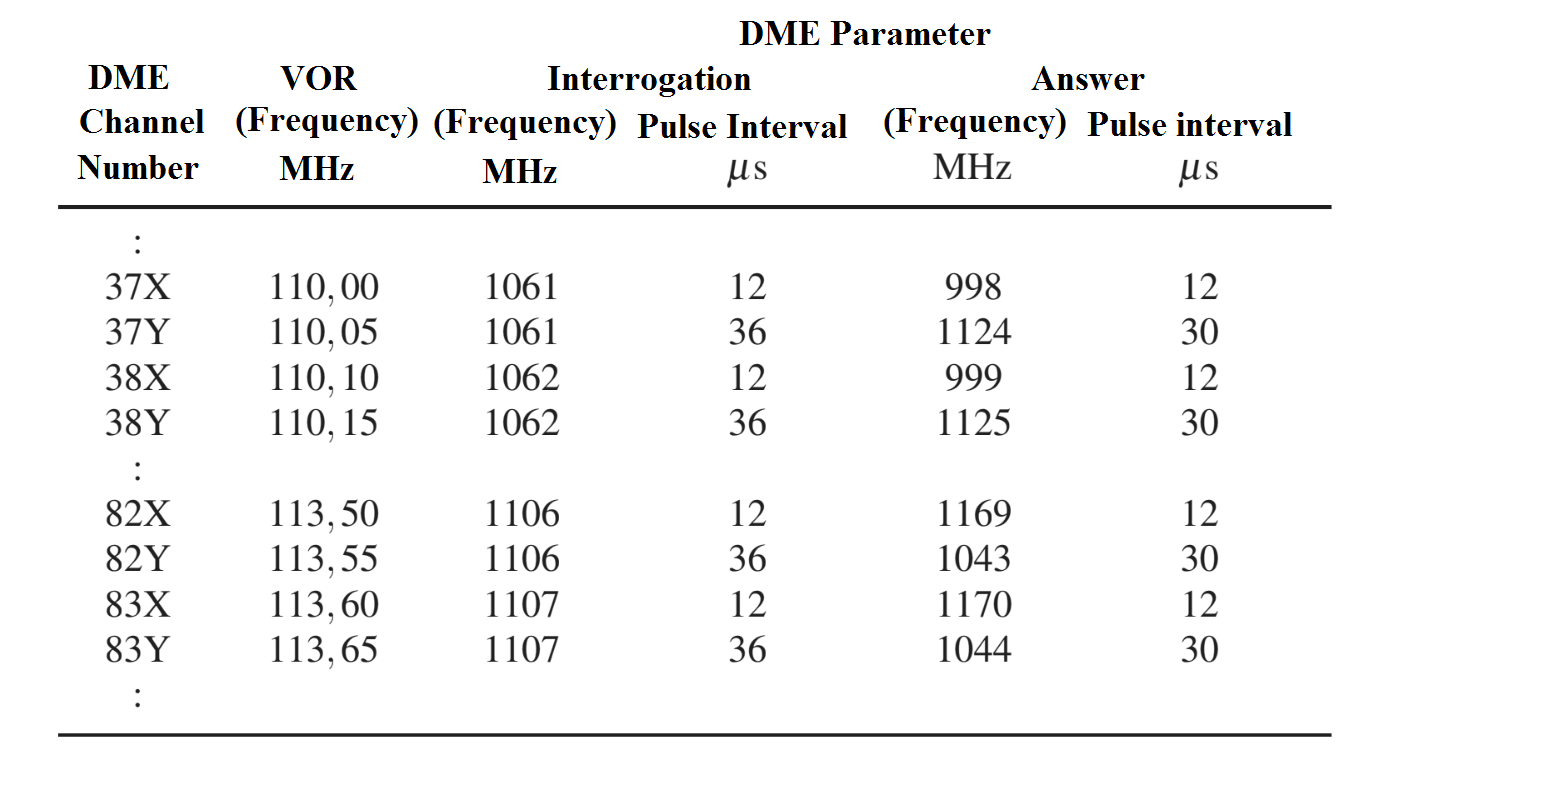
Fig 8. DME table
The aircraft-side DME installation sends the double pulses amplitude modulated with a peak power of about 1.25 kW, the bottom transponder operates with peak power of 15 kW and thus achieves a range of 200 NM.
The ICAO SARPs distinguish three variants of the DME:
- DME / W: broadband DME
- DME / N: narrow band DME
- DME / P: Precision DME
DME / W and DME / N mainly differ by the width of the frequency spectrum (W: wide-spectrum characteristics, N: narrow-spectrum
Signal composition
The DME signal is based on a single pulse, from the pulse pairs or pairs of pulse pairs are assembled. Such a single pulse is Gaussian (Fig.9) with a pulse width of 3.5 μs, its course can be stated mathematically as follows. Here, a is a constant determining the width of the pulse (a = 268 x 103 s-1):
`x_text{DME} (t) = hat s e^(- pi ( a t )^2` (13)
In contrast to a rectangular pulse whose pulse width is easier to measure, the pulse shape used in the DME could have the advantage that its frequency spectrum likewise Gauss formally. Measured at the half-width (-3 dB)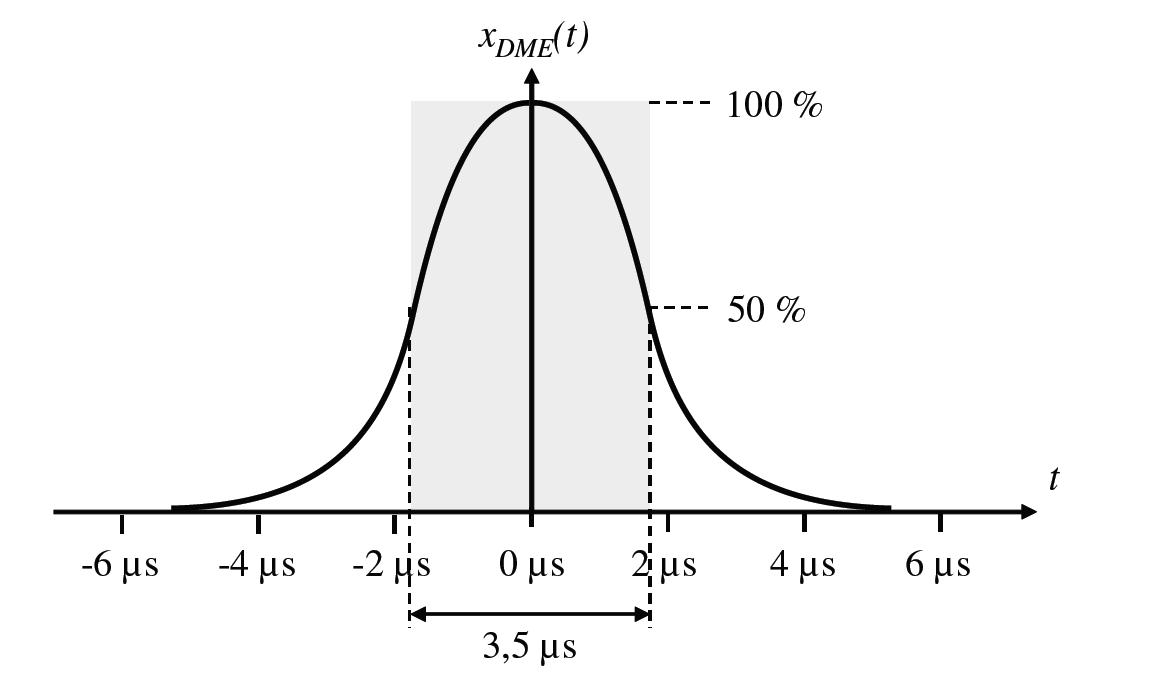
Fig 9. Gauss form of the DME Pulse
the bandwidth of the DME pulse is about 1.6 MHz . By contrast, the frequency spectrum of a rectangular pulse has so-called "fly-backs", its spectral components leak far into the neighboring channels.
The Gaussian pulse is used to drive the high frequency carrier Shaping pulse amplitude modulation (PAM). The envelope of high frequency, therefore also has the characteristic Gaussian bell shape (Figure 10).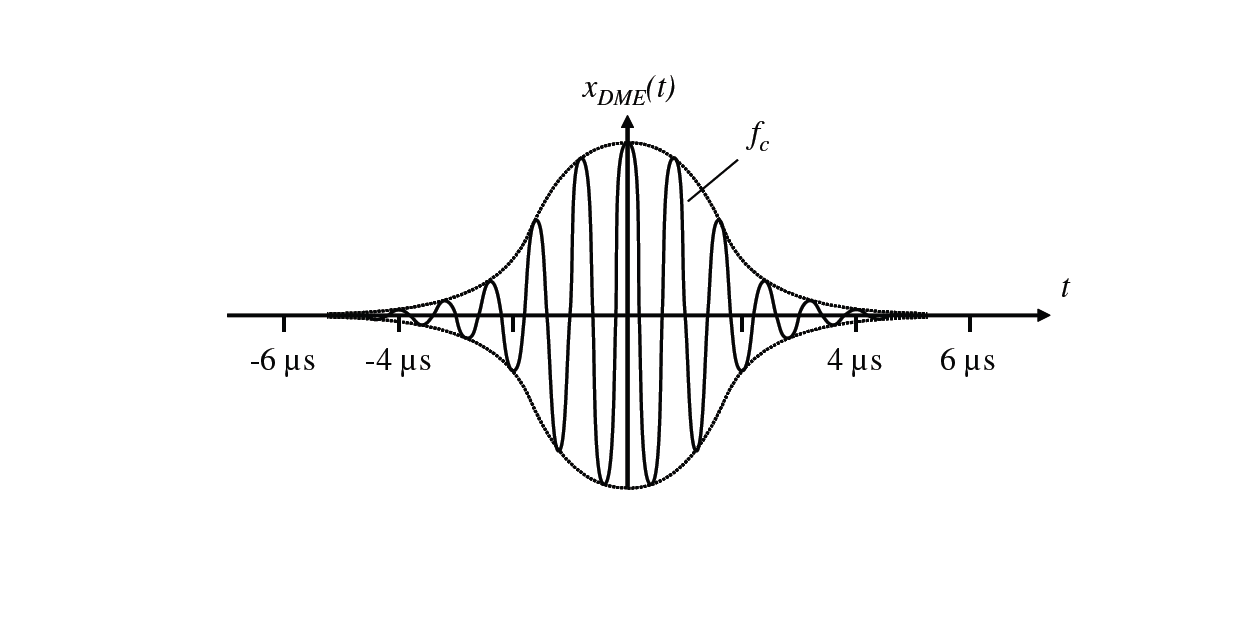
Fig 10. PAM of the high-frequency signal by a Gaussian pulse
To the DME queries and responses, for example, against lightning discharges to ensure that the disturbances caused in the atmosphere have little effect, a quite simple coding is used:
it will be two single pulses sent in a fixed time Distance.
The pulse interval of such a double pulse is 12 μs for X and 36 μs for Y channels in the interrogator. After the frequencies of the X and Y channels are identical (see Fig. 8), the transponder will also communicate this way whether it has to answer in the X or Y grid.
The Ground station uses partly deviating pulse intervals of 12 μs for X 5.4 Distance Measurement (DME) 73 or 30 μs for Y channels.
These become with the time delay between receipt and transmission of a pair of pulses by the transponder visible. While in the X-raster, the response time of the ground station is 50 μs for each pulse, is in Y-raster delays the first pulse of a pair of pulses by 56, the second by 50 μs.
This results in the pulse spacing shortened from 36 to 30 μs for the DME answers of the ground station.
DME stations also send a unique identifier. As long as the used Pulse amplitude modulation is system-determining, the carrier requires no further Sound frequency to be modulated. On the other hand, the transmission of replies to interrogators is interrupted every 37 s for 3 s. In their place will be
Pairs of double pulses - so-called identification pulses (also called "pair of pairs")
- Formed with a time interval of 100 microseconds and sent out. The Identification pulses are repeated at a distance of 740.8 μs, resulting in a audible frequency of 1350 Hz results (Fig 11). During this period the Morse code of the station is transmitted by modulation of the identification pulses.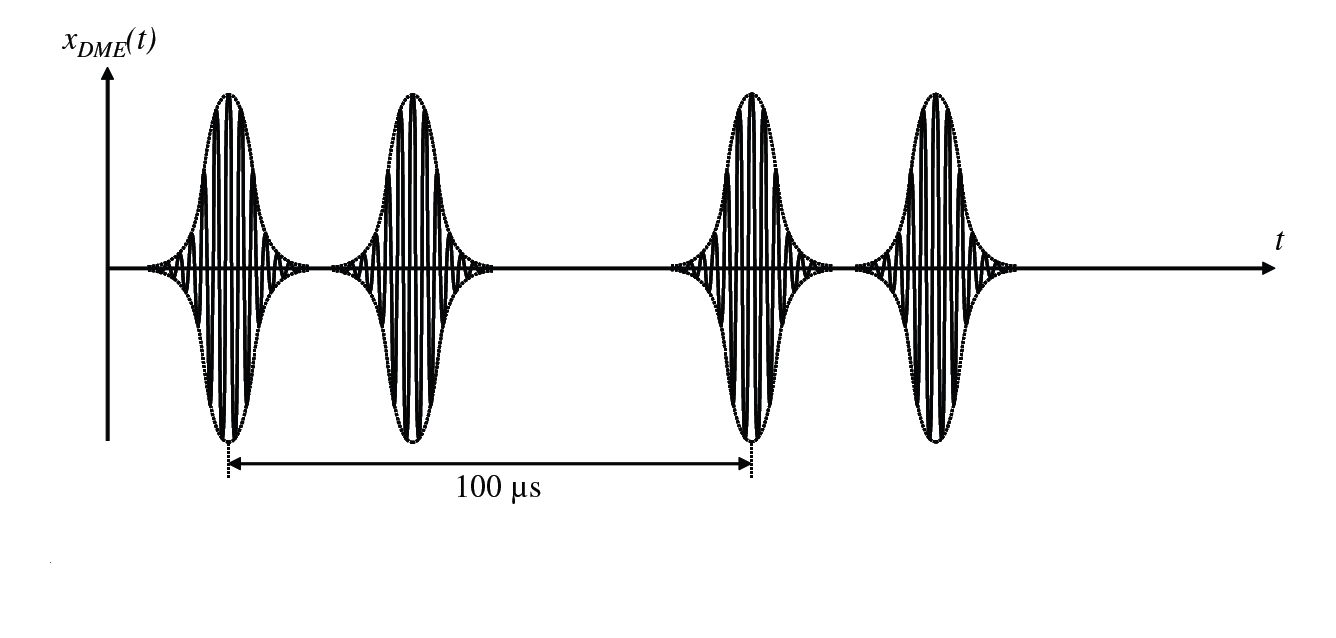
Fig 11. ID pulse for generating the station ID
The ground station of the DME is designed to provide about 2700 - 3000 pulse pairs per second. This number is necessary because TACAN uses the amplitude-modulated pulse pairs as high-frequency carriers for the existing direction information additionally generated there. If an aircraft-side interrogator is in search mode, it sends queries with a pulse repetition frequency of about 150 Hz. If a distance determination has been carried out successfully, it goes into follow-up mode with a pulse repetition frequency of about 30 Hz. In the coverage area of a DME ground station, if approximately 95% aircraft are in search mode and 5% aircraft are in search mode, the maximum capacity of a ground station can be about 100 aircrafts, which can be supplied with answer pulp pairs, if the ground station is underutilized, it sends so-called filling pulses (squitter) with randomly selected pulse spacing.
Evaluation of the signal
The above outlined cycle between the onboard station and answer of the Ground Station is used to control the distance between the aircraft and the DME station. In this context, the concept of radar mile was coined, indicating the time TRM, in which an electromagnetic wave travels a nautical mile back and forth, twice, through:
`T_text{RM} = (2 * 1 text{NM} )/c_0 = (3704 text{m} )/(2.99 * 10^6 text{m/s}) = 12.35 mu s` (14)
Is measured by the onboard DME device, the total signal transit time Δt2= 2Δt and the signal delay ΔtXPDR in the bottom transponder is known, follows from this the slant range `rho`:
`rho= (c_0 ( Delta f_2 - Delta f_text{XPDR} ) )/2` (15)
Read more about SkyRadar's NavAids Simulator or watch introductory Videos on the subject.
References
Fig1. ILS block diagram
Fig 2. VOR without ident
Fig 3. Magnitude spectrum of the VOR radiated signal
Fig 4. Signal CVOR
Fig 5. Crossdipol with quatrature components
Fig 6: Generation of the Cardioid-form antenna characteristics
Fig 7. Conception of the X and Y channels at the DME
Fig 8. DME table
Fig 9. Gauss form of the DME Pulse
Fig 10. PAM of the high-frequency signal by a Gaussian pulse
Fig 11. ID pulse for generating the station ID