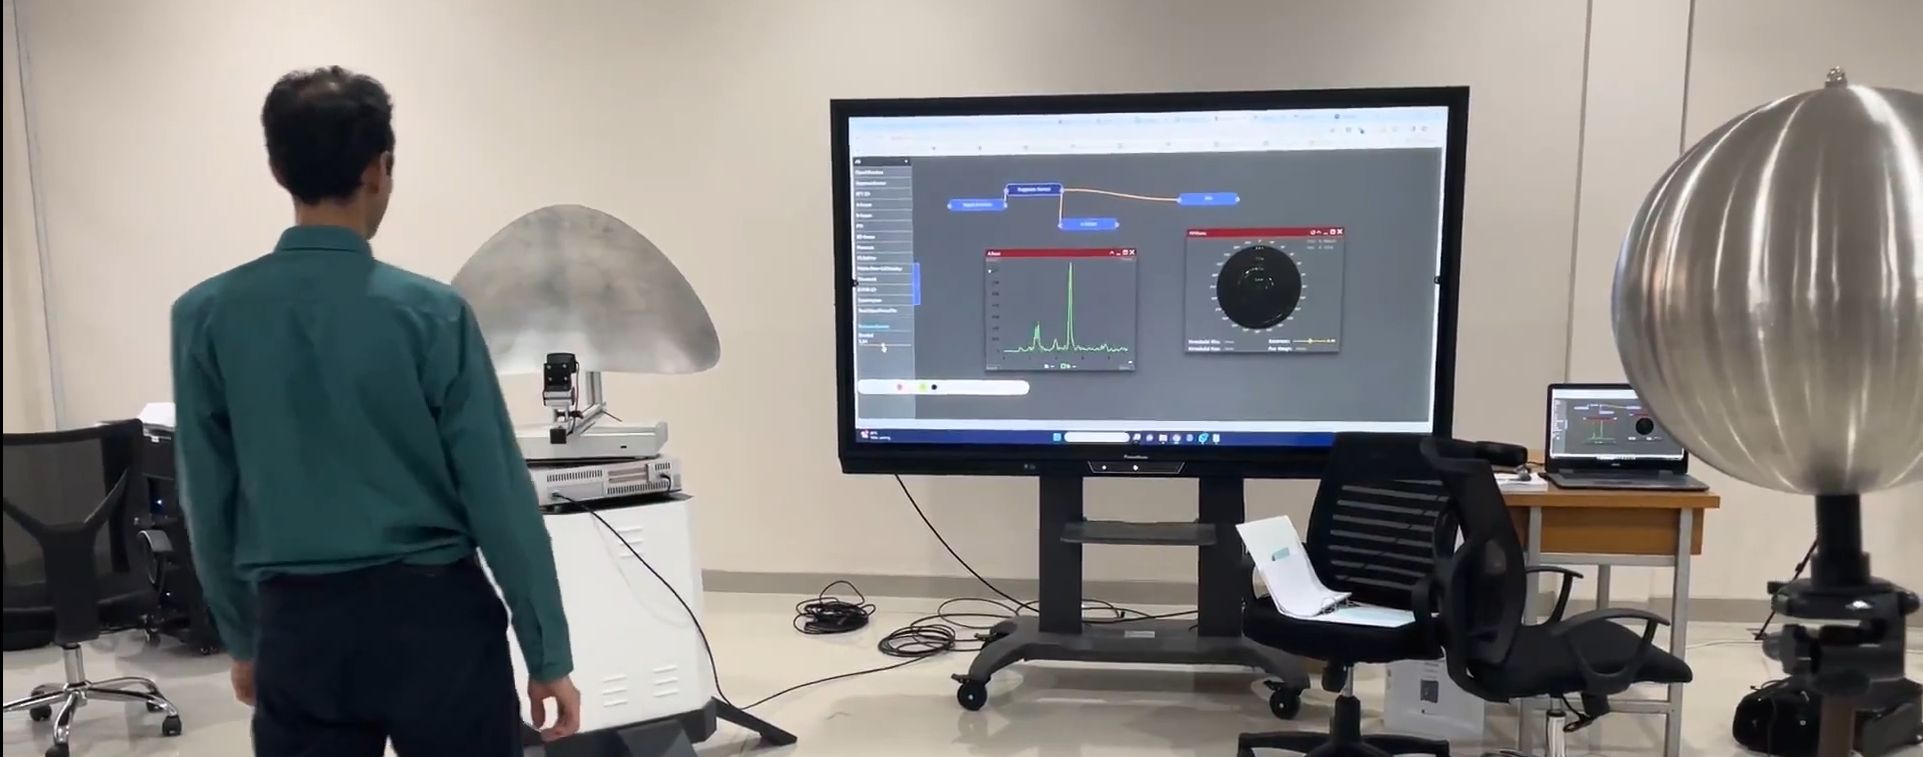
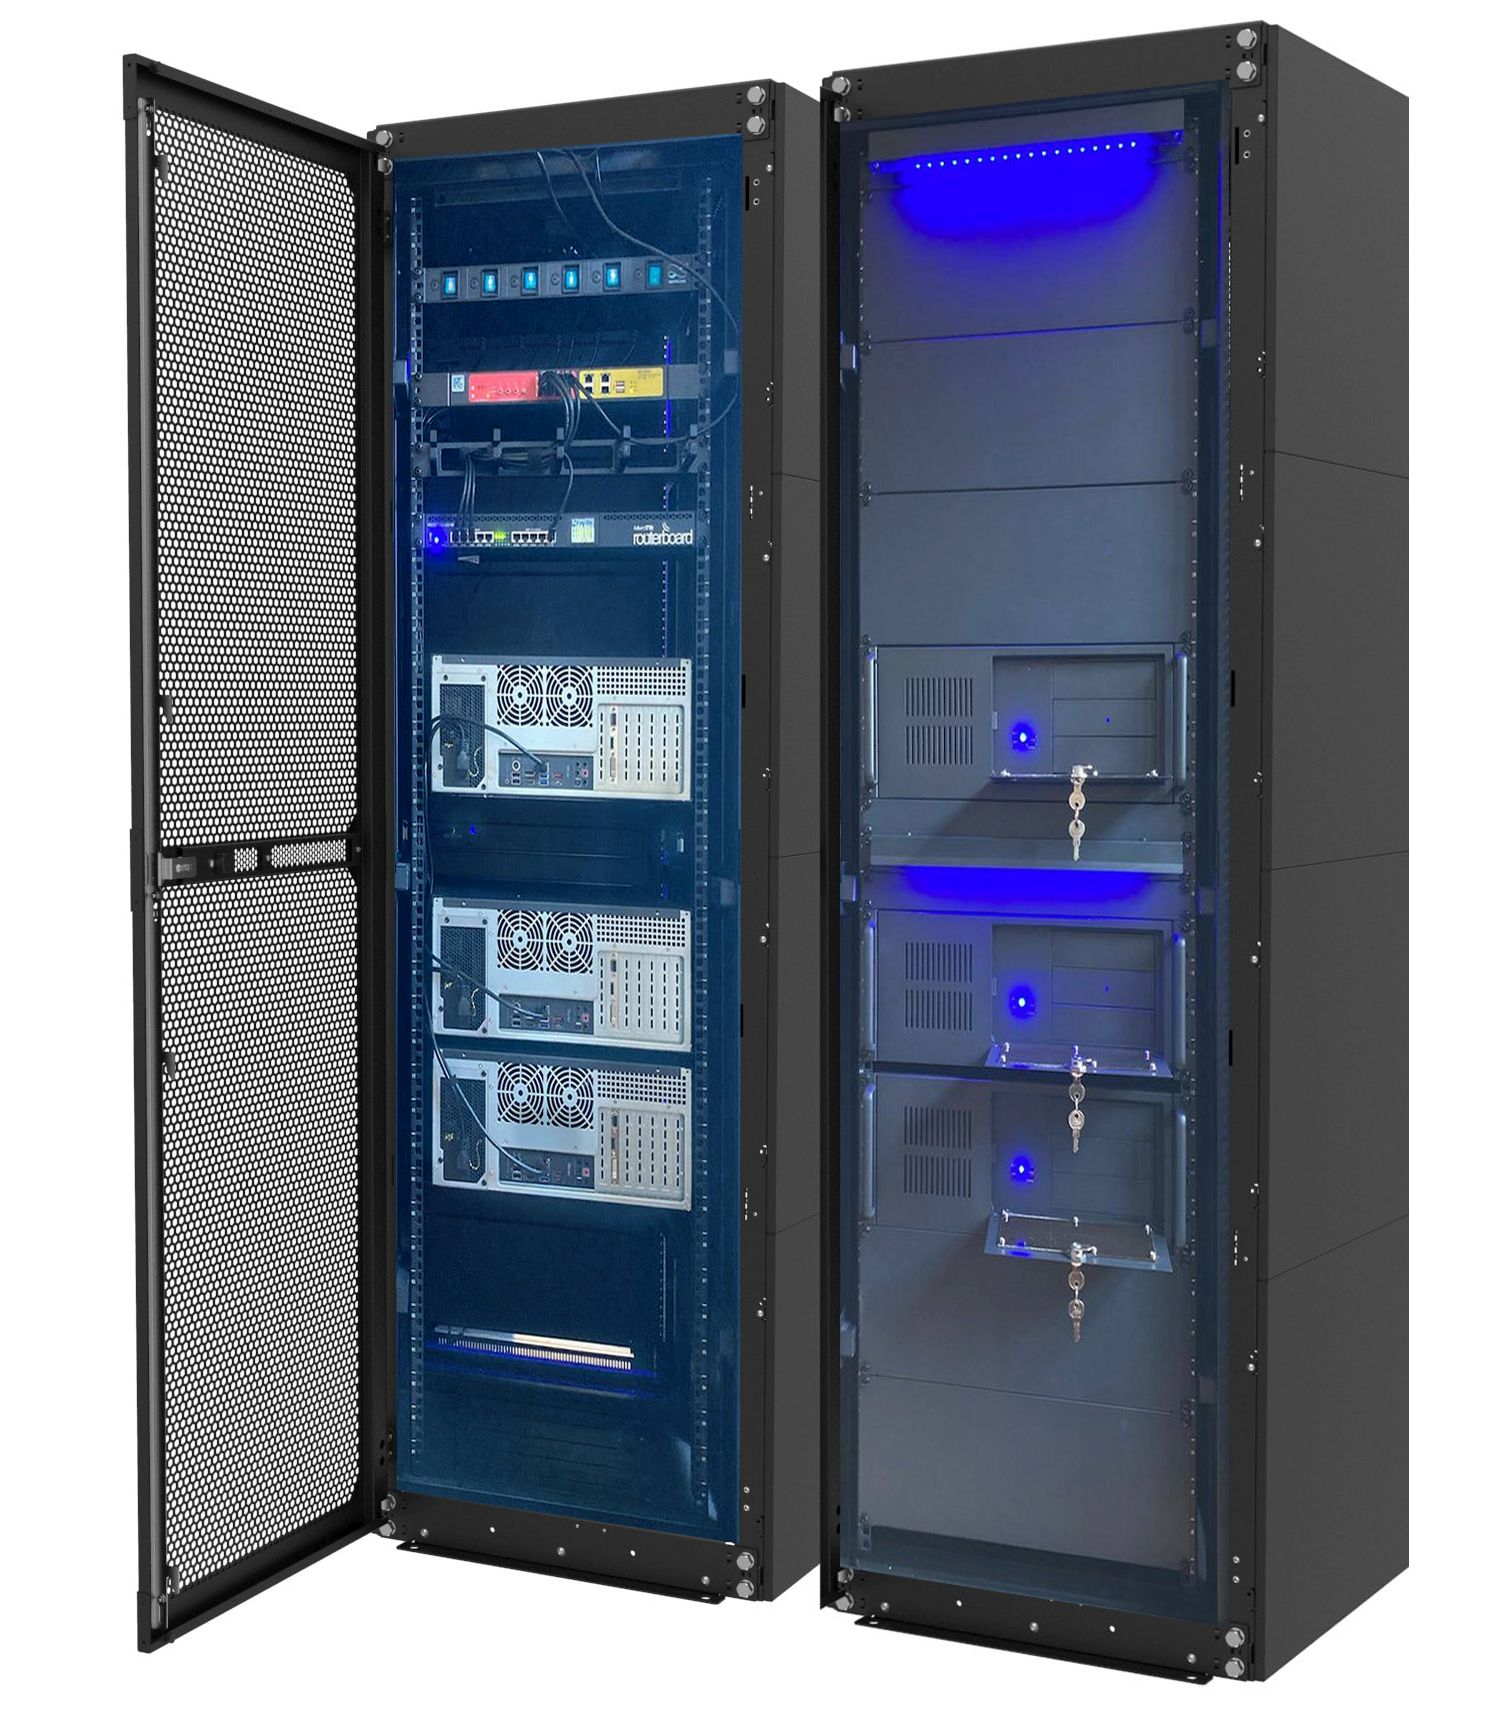
SkySMC is a modular System Monitoring Control (SMC) solution. It offers customizable configurations and includes a pedagogically enhanced monitoring environment and a simulated Air Traffic Control (ATC) environment. Integrated with SkyRadar's virtual and physical training laboratories, it connects to special training infrastructure and allows for remote monitoring and control experiments. Accessible from all computers within available laboratories, it meets the requirements of EASA's Easy Access Rules for ATM-ANS (Regulation (EU) 2017/373).
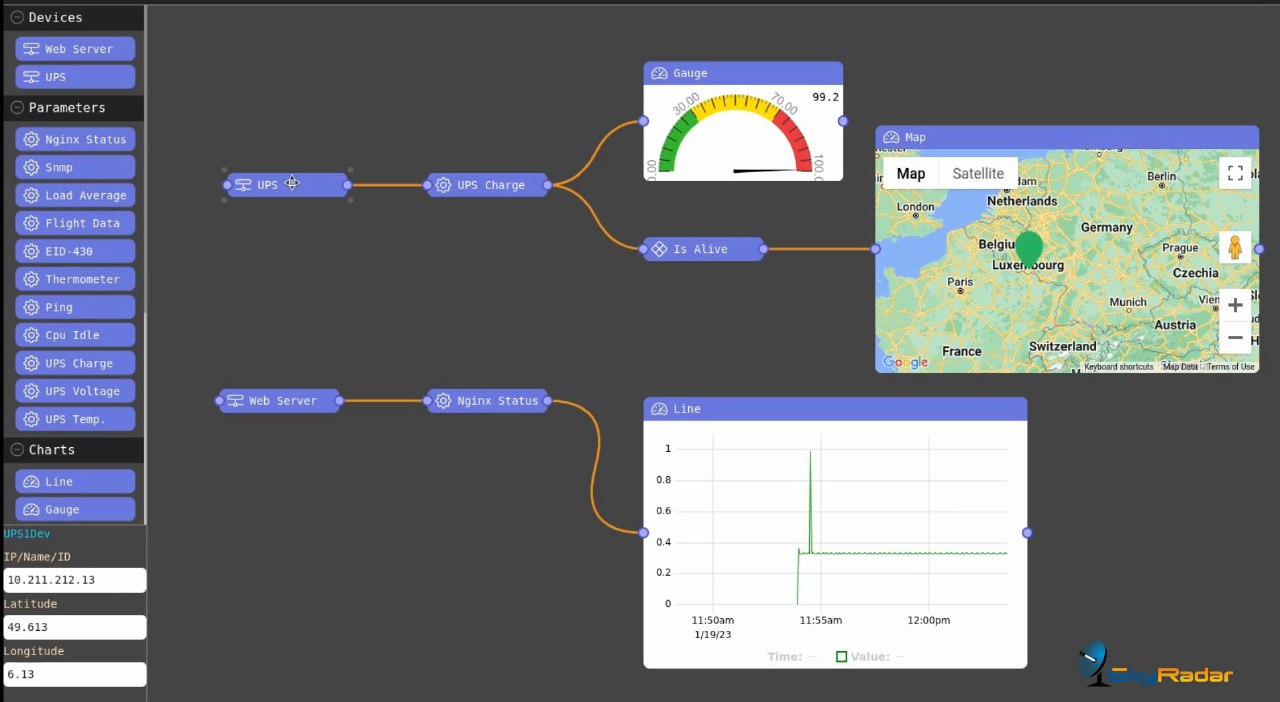
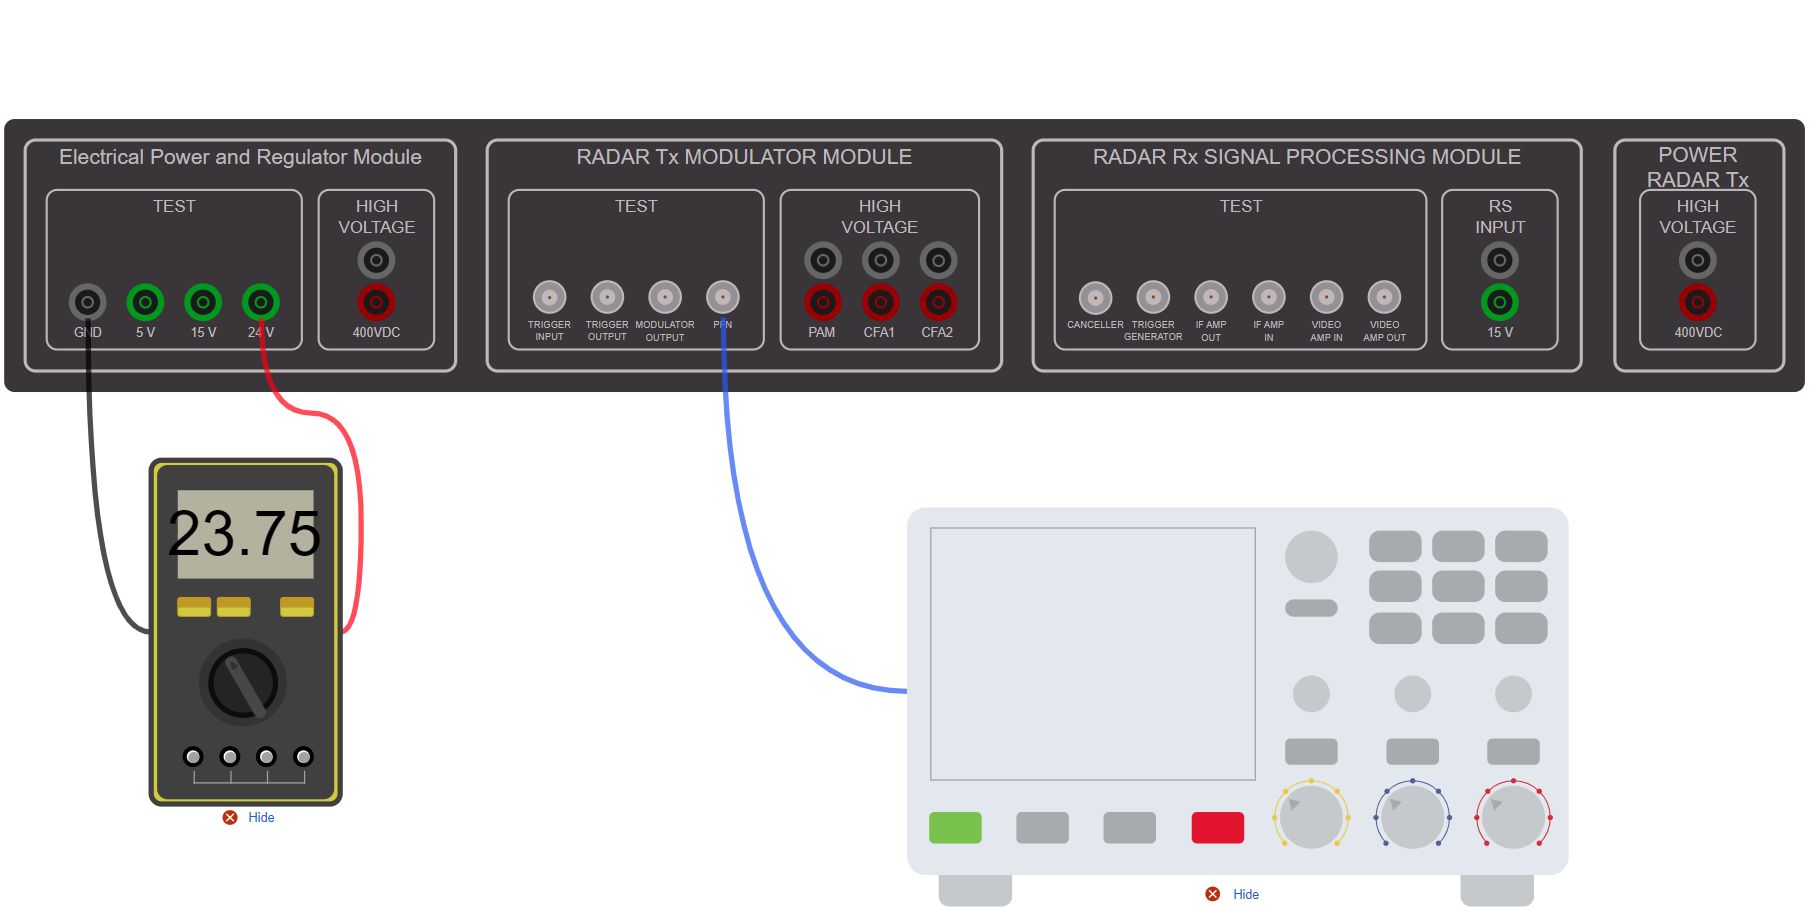
SkySMC can read many standard message formats like SNMP, JSON, MQTT or ASTERIX. It can connect simulated, virtual and real infrastructure into a common augmented reality. Any external device with OID address can be connected.
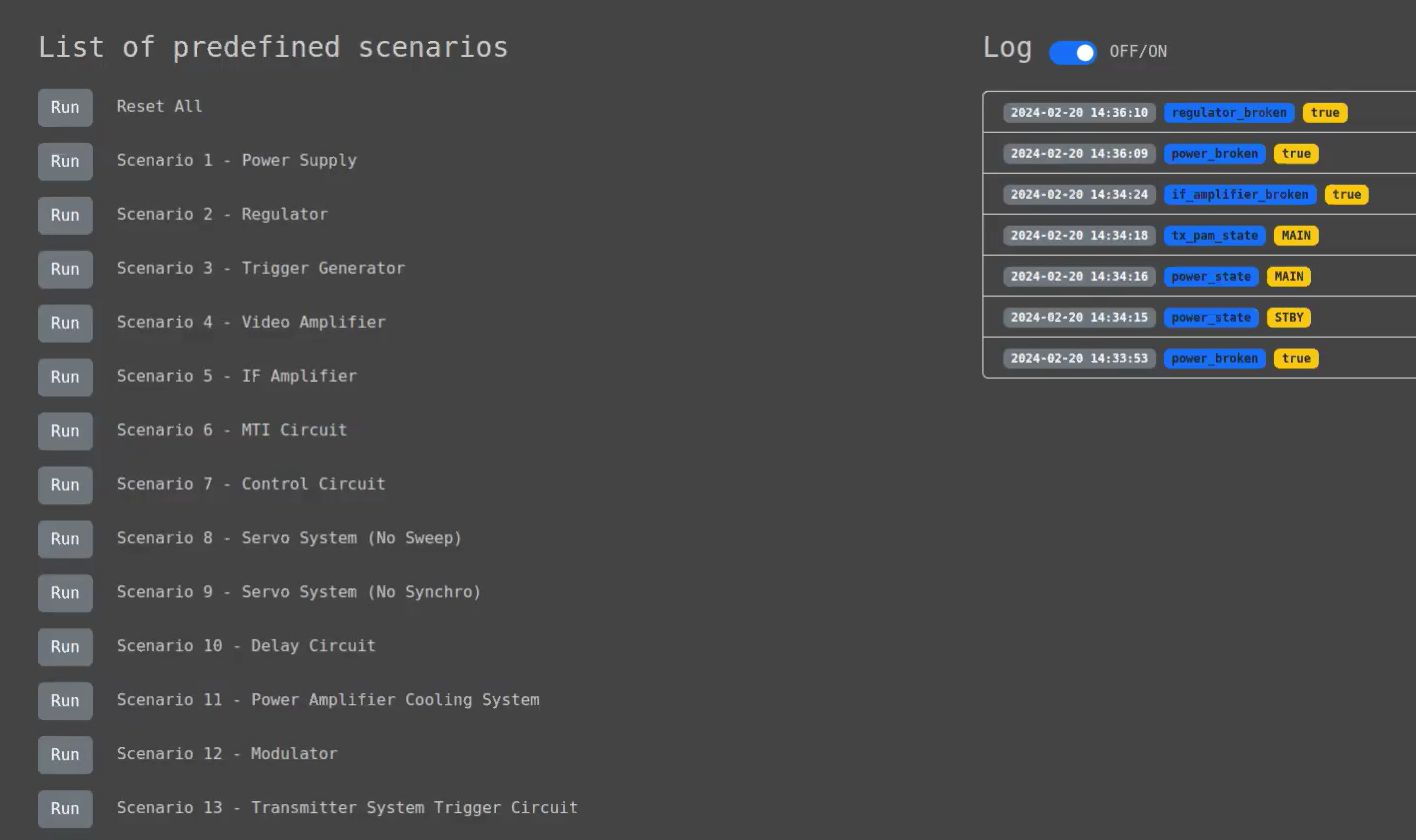
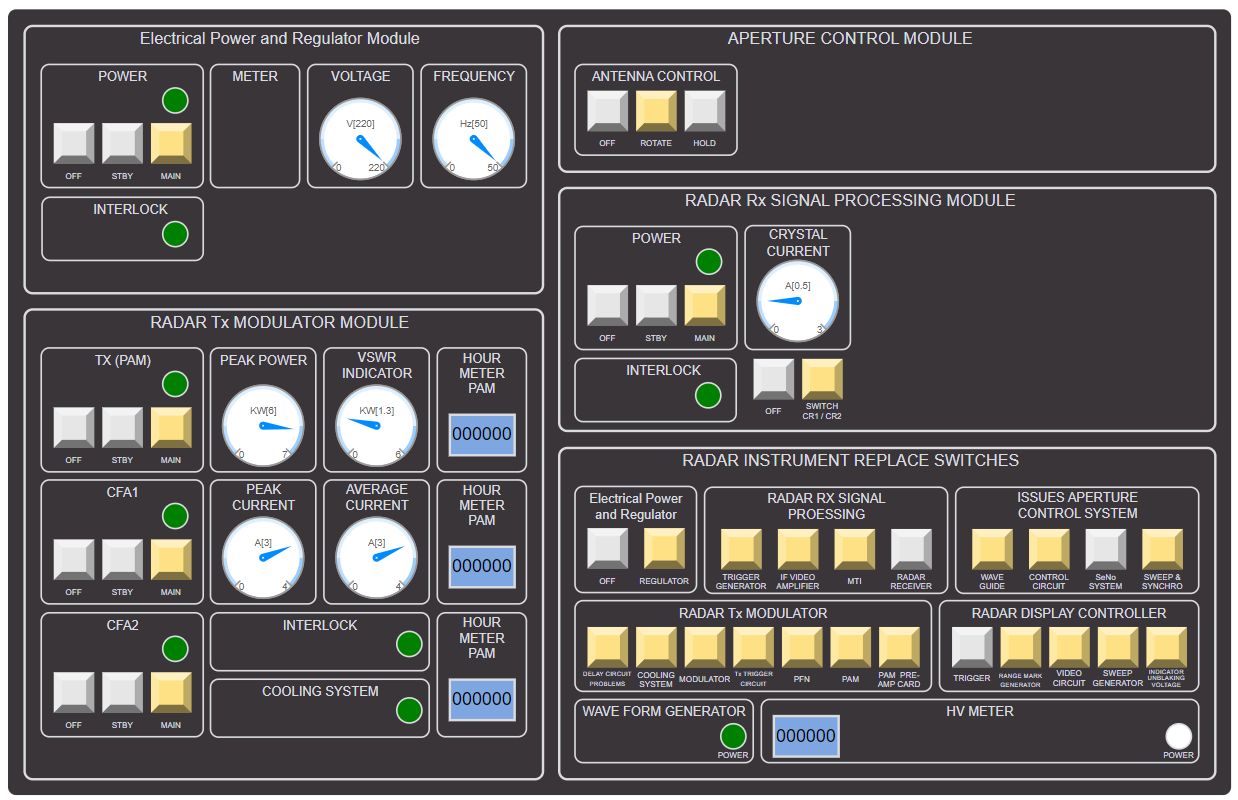
SkySMC, can monitor, switch and parametrize. It allows to include errors and to log and document student performance.