advanced-menu-icon

FreeScopes Basic II -  Description & Datasheet

print-icon

FreeScopes Basic II expands the vector oriented signal processing of FreeScopes Basic I into an array-based approach, making Fast Fourier Transform, heatmap, Doppler filters or 2D CFAR possible. It also provides additional blocks such as RCS or Spectrogram.

SkyRadar-FreeScopes-Basic-II-Overview


POSSIBLE EXERCISES

This module builds on FreeScopes Basic I. The variety of possible exercises is only limited by the creativity of the teacher. Here are some examples:

  • Moving from a Vector to an Array and displaying radar data in 3D
  • Radar Cross Section
  • Experimenting with the twod dimensional Fast Fourier Transform FFT and the Doppler Effect
  • Understanding the radar spectrogram
  • Optimizing the radar image with a two dimensional CFAR
  • Displaying the Doppler effect in a heatmap
  • Windows functions
  • etc.

Burst

By default, radar data is a vector. Every set of data (which is called "frame") contains the value of each range cell from rangemin to rangemax. The connection of these values with a line creates the curve of the A-Scope. Burst adds to this dimension a defined number of frames (z-axis in the image above). The result is a matrix of data which is valuable in many 2-dimensional algorithms like the 2-D CFAR or the 2D Fast Fourier Transform (2D FFT).

3D-Scope

The 3D-scope is able to display 3 dimensions. 3 dimensions are necessary as many functions in this package will handle arrays (2 dimensions) plus the amplitude.

The 3D-Scope is placed after the Burst block which creates a matrix from the range cells and a sequence of last frames. In this constellation, the X and Y axis can be imagined as A-Scope, Z and Y axis as B-Scope.

Heatmap

Heatmap block is another block developed for visualizing 3D signals where x- and y-axis give the coordinates and the color coding gives the amplitude of the signal. In Freescopes the heatmap is used extensively to observe the Doppler effect.

Fast Fourier Transform FFT

Fast Fourier Transform (FFT) is a powerful mathematical tool, which is widely used in signal processing. It enables data captured in the time domain to be displayed in the frequency domain.

The Fourier control block allows to shift the right and the left half of the frequency set (and thus centering it to the middle), or to only display only half of the frequency range. This manipulation can be done for the x or z axis.

CFAR (2D)

Similarly to the 1dimensional CFAR from FreeScopes Basic I, the 2 dimensional version of CFAR dynamically adapts to the constellation of noise and targets at each specific point. However, it averages across range and Doppler cells.

Radar Cross Section RCS

The radar cross section (RCS) of a target is the equivalent area seen by a radar. It is a measure of detectability and called the electromagnetic signature of the object.

It is estimated in the PPI

Windowing Functions

Windowing (also known as weighting) functions are used to combat spectral leakage from digital signal processing (discontinuities). 

The Fast Fourier Transformation (FFT) needs one period of a periodic signal. In the FFT, the discontinuities create high-frequency components, which were not present in the original signal. Therefore, a problem arises when applying FFT to measure the frequency components of a radar signal. 
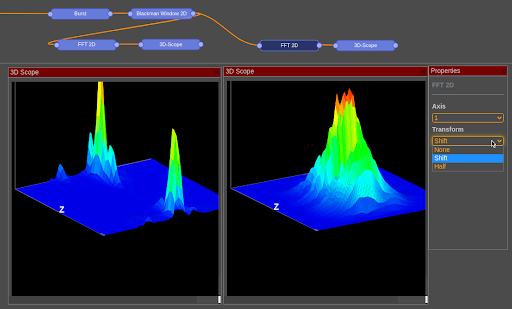
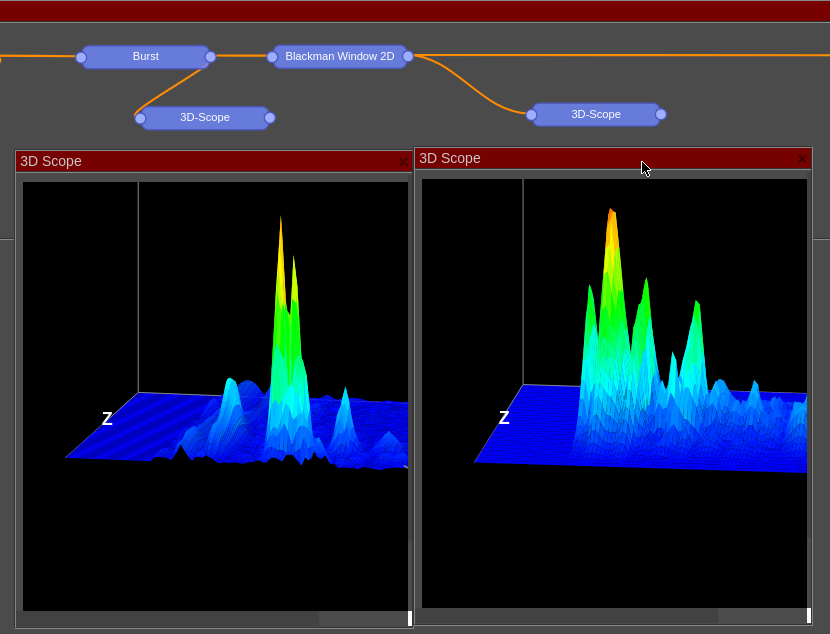
The windowing technique is used to overcome the aforementioned problem. It reduces the discontinuities at the boundaries. It enables the amplitude to vary smoothly and gradually reduce toward zero at the edges, resulting in a continuous waveform.

Freescopes includes the following Windowing Functions:

  • Hann (also known as Hanning)
  • Blackman
  • Hamming
  • Bartlett
  • Kaiser

Spectrogram

The spectrogram provides the frequency representation of the signal in logarithmic scale, so simply: log(fft(sig)).

It is needed for in depth wave analysis, e.g., when unmasking active targets and DRFM jammers.

Row & Column Selector

Sometimes, the radar operator wants to look at one specific vector in the signal's matrix. To do so, FreeScopes Basic II provides a column and row selector. The user can handpick and row or column and use it for subsequent analysis.

The FreeScopes applications get active in a plug-and-play approach, as soon as the radar on its own, or in conjunction with the SkyRadar CloudServer are plugged in.