


The following video visualizes the Doppler frequencies of a person approaching and moving away from the radar source. We apply Fast Fourier Transform.
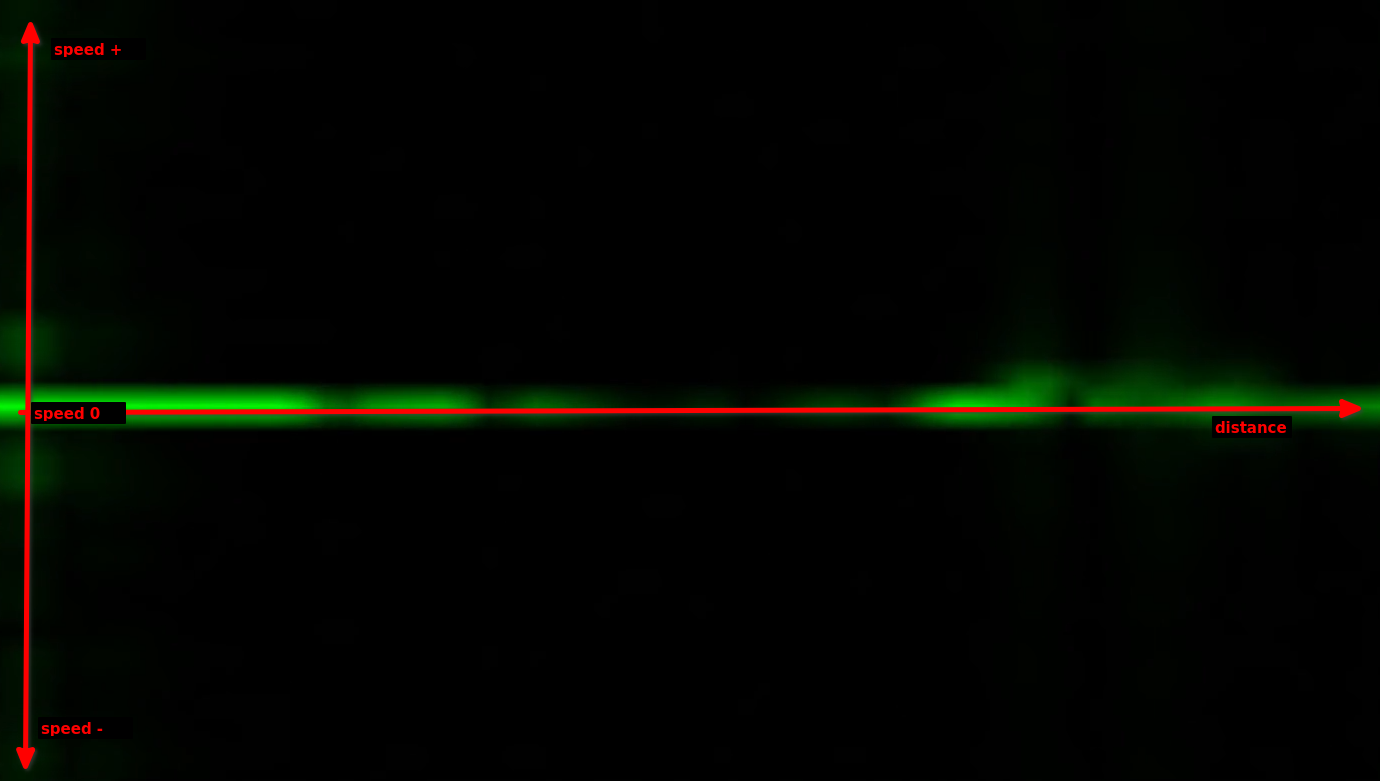
In the B-Scope, we can visualize a heatmap of range and Doppler.
The horizontal line in the center of the B-Scope is the "zero-speed"-line. Dots above the line indicate positive speed, meaning an approaching movement. Dots below the zero-speed line indicate distancing movements. The x-axis represents the distance from the radar source.
The signal is analyzed with the help of the Burst block and the FFT block. Both are part of FreeScopes Basic II.